

GreenCode mines a running estate, rebuilds a representative copy of it as green infrastructure as code, and monitors it so energy and CO2e can be attributed to the services that cause them.
Software energy figures mean very little without the machine they were measured on. A saving demonstrated on a developer laptop says nothing about a service running across a cluster, and a cloud bill says nothing about which service caused it. This feature exists to give the rest of the pipeline a truthful place to measure, and to give the organisation a picture of where its infrastructure energy actually goes.
It has two halves. The first reconstitutes an environment: GreenCode mines both the codebase and the running estate for infrastructure information, generates green infrastructure-as-code templates from what it finds, and launches a representative deployment, building components where none can be discovered. The second monitors that environment, estimating energy from resource metrics and converting it to CO2e, then attributing the result to the services, processes and components responsible.
This is stage three of five. It follows the codebase mapping and quality baseline, and it exists so that stage four, benchmarking and energy optimisation, has somewhere controlled and instrumented to run. The input is the indexed codebase, the interface inventory and whatever can be read from a live estate. The output is an infrastructure definition, a deployed and instrumented copy of the system, and a monitored baseline against which every later change is compared.
The headline target depends on it. A net reduction of at least 15% is measured from the original codebase on its generated infrastructure to the optimised one, so the environment has to be reproducible for the figure to mean anything at all.
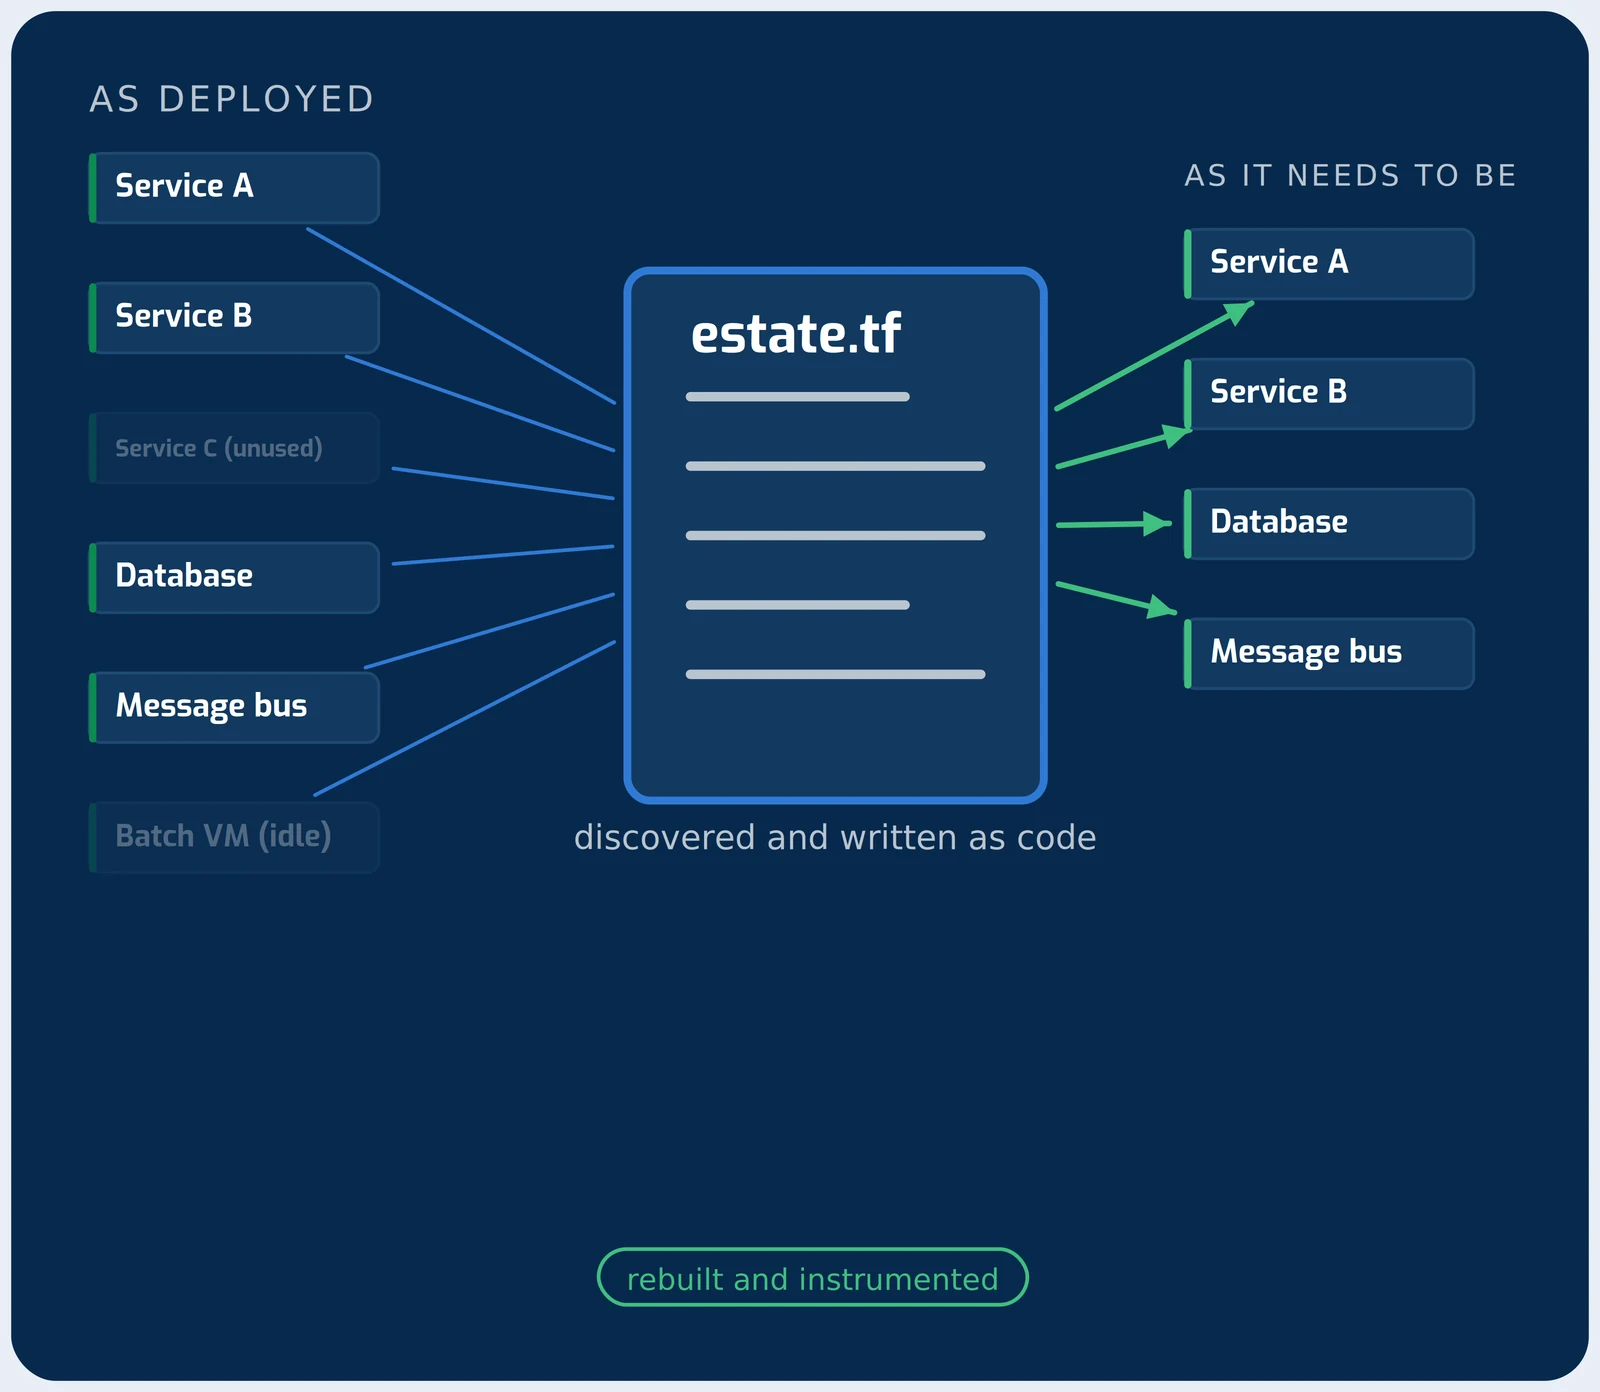 View full size
The measurement review sets the rules. Energy can be read at the wall plug, from on-chip counters, from a cloud provider's telemetry or from a model driven by resource metrics, and these differ in precision, coverage and cost. Estimates at infrastructure scale are modelled rather than metered, so each figure carries its method and its confidence with it. The point is not to claim a false precision but to make the basis of every number visible, which is also what an auditor asks for. The reporting consequences are described under accurate ESG data for CSRD reporting.
Assessment leads to operation. Once consumption is attributed, resources can be managed against it: scaling with demand and with the carbon intensity of the grid, shifting flexible work to cleaner or cheaper hours, and pausing non-essential features when a site is under energy stress. This is the green DevOps end of the project, and it draws on partner research published through GreenCode on scheduling Kubernetes workloads in green-powered microgrid data centres and on load shifting in data centres with renewables, both listed at publications.
The state of the art review found the scale of the waste well documented and the attribution poorly solved. Cloud servers are active only 10 to 30% of the time, and the rest is paid for in electricity and in hardware bought against a peak that inefficient software created. Reducing what the software asks for, then rebuilding the estate around the reduced demand, is the subject of reduced infrastructure requirements.
Organisations that want to trial the assessment on their own estate can get in touch via the contact page.